Figure 3.
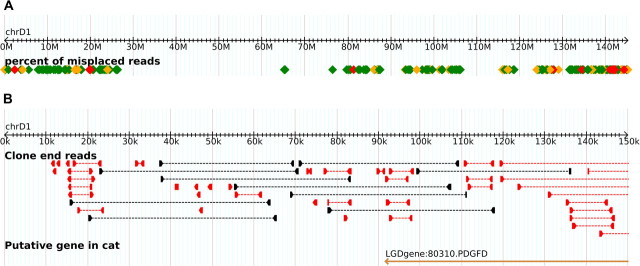
FA-SATs at the telomeres of chromosome D1. The GARFIELD genome browser includes a track for showing regions of possible assembly artifacts. (a) The chromosome view includes the color-coded regions representing the percentage of misplaced reads in windows of 10 kb. Windows having a high percentage of outliers are represented in red and orange, whereas low, yet nonzero, levels are in green. (b) The detailed view of GARFIELD shows paired end reads of the assembly. Inconsistently placed end reads are displayed in red. Well-placed end reads (those that are 31.4–49.5 kb apart) are in black. Well-placed plasmids are so numerous that they are not included in the display.

