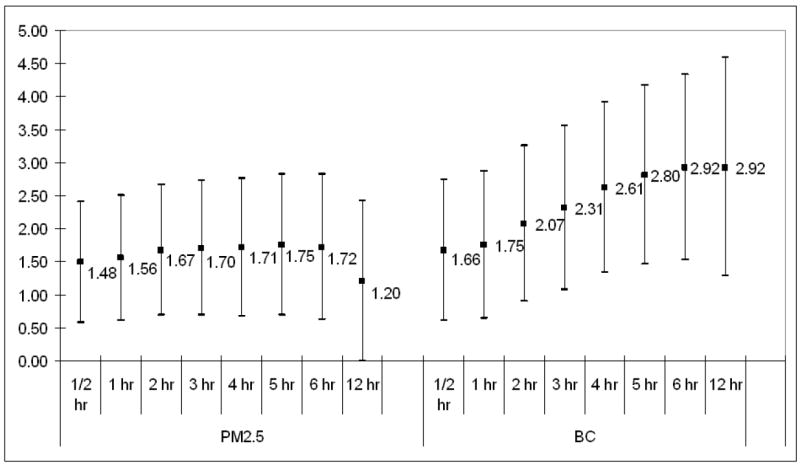
Figure 1.

Twenty-four hour estimated circadian pattern of TWA-MAX, plotted as the mean of TWA-MAX values for each half-hour period of the day, controlling for subject, day of the week, being in traffic, average heart rate, hour of the day, date, mean temperature, and BC. The curve and pointwise 95% confidence interval (dotted line) are estimated using a penalized spline.
