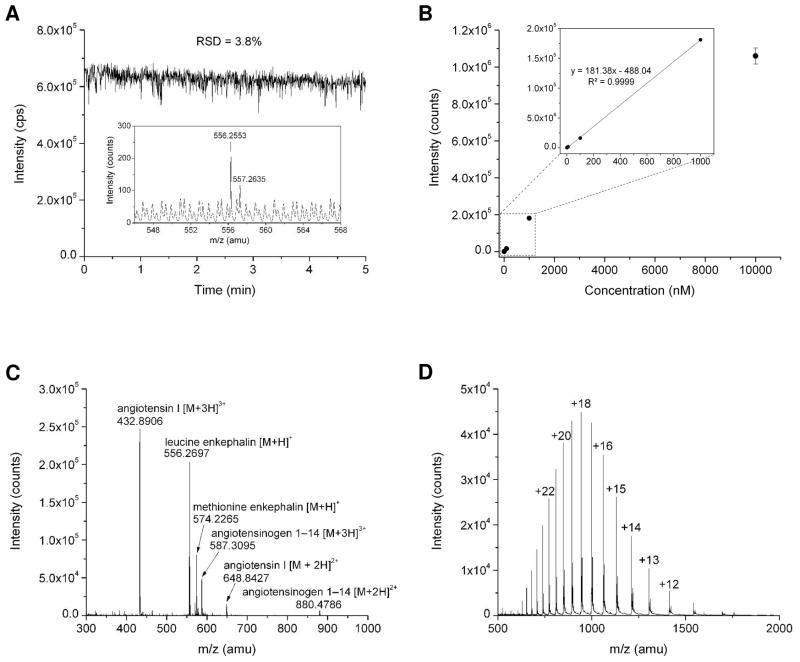
Figure 5.
(A) Total ion trace of 1 nM leucine enkephalin solution using PDMS membrane based ESI emitter. Inset is the averaged mass spectra in a period of 1 min. The infusion flow rate was 100 nL/min and the applied ESI voltage was 2.8 kV. (B) The averaged signal intensity of leucine enkephalin at different concentrations. (C) and (D) Mass spectra of a mixture containing four peptides (1 μM) and apomyoglobin (1 μg/μL), respectively. The infusion flow rate was 100 nL/min and the applied ESI voltage was 2.5 kV.

