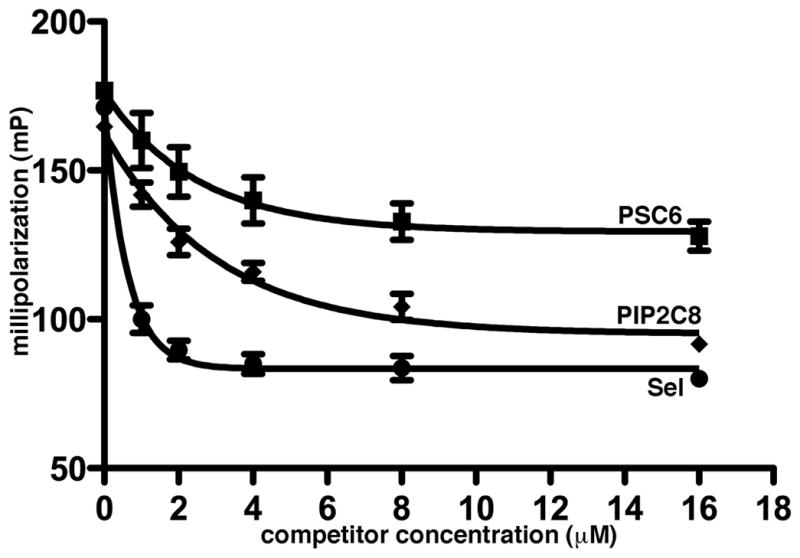
Figure 4. Fluorescence Anisotropy competition binding assays.

FA competition binding assays were performed with 5 nM FITC-Sel25 and 1 μM MyrMA plus increasing concentrations of untagged Sel25, di-C6 phosphatidyl serine (PSC6) or di-C8 PI(4,5)P2 (PIP2C8). Measurements were obtained in triplicate and dissociation curves were fitted to exponential decay best fit curves.
