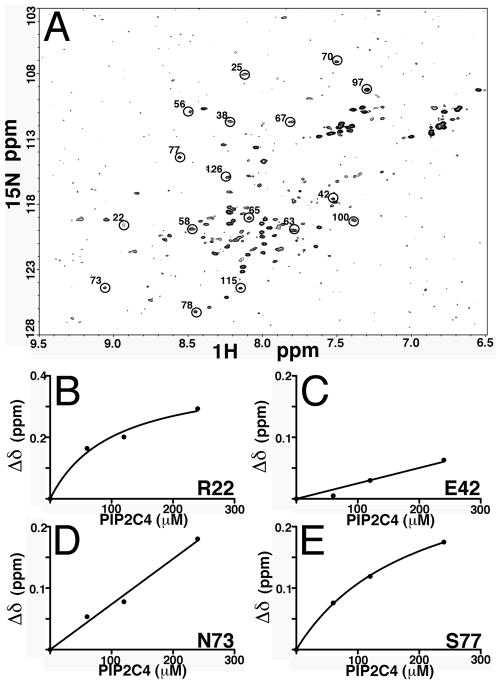
Figure 7. NMR of MA-PI(4,5)P2 binding.
(A) 1H-15N heteronuclear single quantum coherence spectrum (HSQC) of 15N-labeled MA at 60 μM was obtained at pH 5.5 and 35°C. Indicated in circles are some of the unambiguously residue assignments. (B–E) 15N NMR chemical shift titration data of 60 μM MA and 0, 60, 120 and 240 μM di-C4-PI(4,5)P2, di-C4-PI(4,5)P2: MA= 0:1, 1:1, 2:1, and 4:1 were obtained at pH 5.5 and 35°C. Binding curves are plotted for representative residues and are in agreement with previously obtained results.

