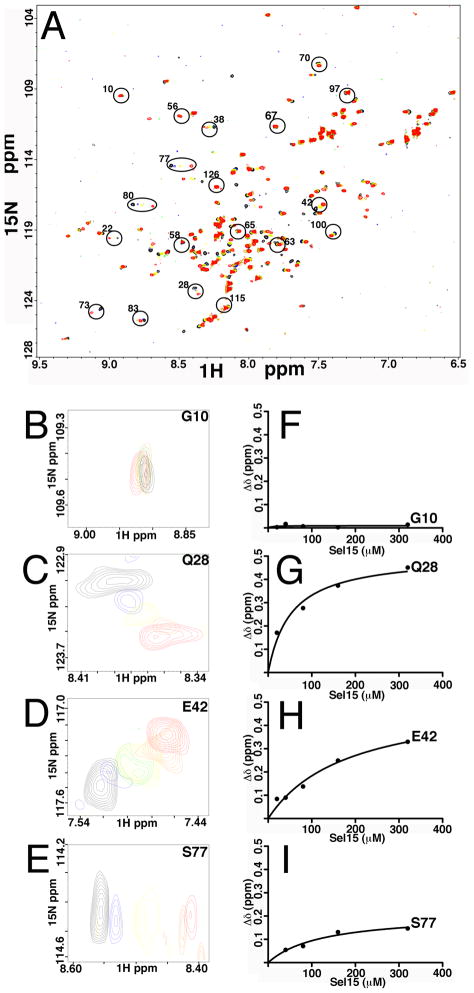
Figure 8. MA binding to Sel15 RNA.
(A) shown is an overlay of 2D 1H-15N HSQC spectra upon titrations with Sel15 RNA at the following RNA: MA ratios: 0:1 (black), 0.25:1 (blue), 0.5:1(green), 1:1 (yellow), 2:1 (orange), and 4:1 (red). Indicated in circles are some of the unambiguously assigned residues. (B–E) representatives of overlay expanded portions of the 2D 1H-15N HSQC are shown, with same titration ratios as in (A). (F–I) Representative binding curves of 1H-15N NMR chemical shift titration data of MA are depicted. The Δδ values are defined as ΔδHN = ((Δδ 1H)2 + (Δδ 15N)2 )½, and binding isotherms were fitted assuming a 1:1 binding stoichiometry. Note that G10 is provided as an example of a residue that is not affected by RNA binding, whereas Q28, E42 and S77 are examples of residues that were affected by binding.

