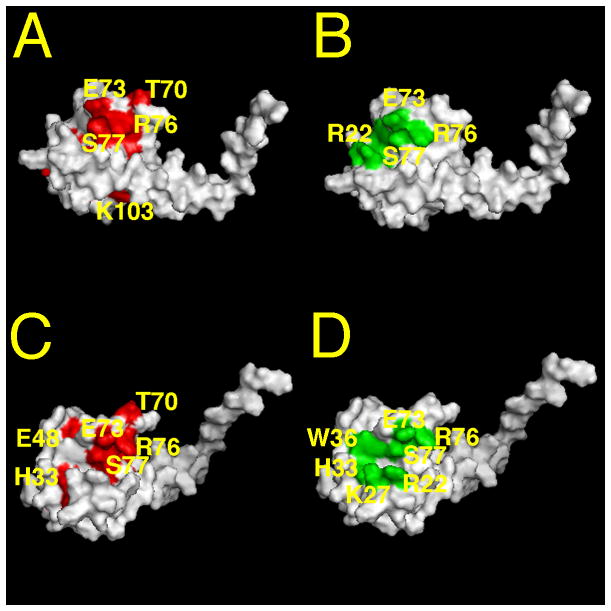
Figure 9. MA binding sites of RNA and PI(4,5)P2.
Shown is a surface representation of MA structure (pdb ID: 1UPH) from the side (A, B) and slightly tilted from the side (C, D). In panels A and C, residues that exhibited significant chemical shift changes (ΔδHN ≥ 0.15 ppm) on Sel15 RNA binding are colored in red. In panels B and D, di-C4-PI(4,5)P2 binding residues are highlighted in green. For convenience a subset of the binding residues is labeled.

