
Figure 3.
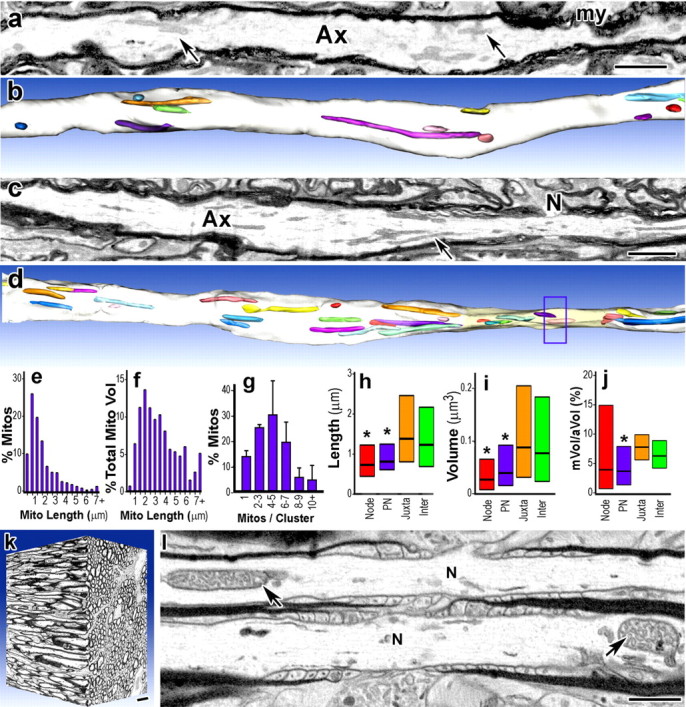
Mitochondria are not enriched in nodal axoplasm and stationary sites usually contain multiple mitochondria. a–l, The three-dimensional distribution of axonal mitochondrial was determined by serial-section electron microscopy of rat cerebellar white matter (a–i) and mouse optic nerve (j–l). a–d, Single sections (a, c) and 3D reconstructions of internodal (b) and nodal (d) regions of cerebellar myelinated axons (Ax). A node (c, N) is marked in the 3D reconstruction (d, box). e, f, Axonal mitochondrial lengths vary from <1 μm to >7 μm (e). Axonal mitochondria longer than 4 μm represent <10% of the total axonal mitochondria (e), but >25% of the total axonal mitochondrial volume (f). g, Internodal mitochondria (a, c, arrows; b, d, colored areas) frequently overlap and 86% are present in clusters of 2–11 mitochondria (Mito). h, i, Mitochondria in nodal and paranodal (PN) axoplasm are shorter (h) and smaller (i) than mitochondria in juxtaparanodal (Juxta) and internodal (Inter) axoplasm. j, The ratio of mitochondrial volume to axonal volume (mVol/aVol, expressed as a percentage) was highly variable in nodal axoplasm, and many nodes (39%) lacked mitochondria. k, Mitochondria in mouse optic nerve axons were distributed similarly to those in myelinated cerebellar axons. l, Internodal mitochondria (arrows) were abundant and 67% of nodes lacked mitochondria. g, Bars, Mean + SEM. h–j, Boxes, Median with first and third quartiles. *p < 0.001 Mann–Whitney U tests. a, c, Images montaged from serial slices. Scale bars, 1 μm.