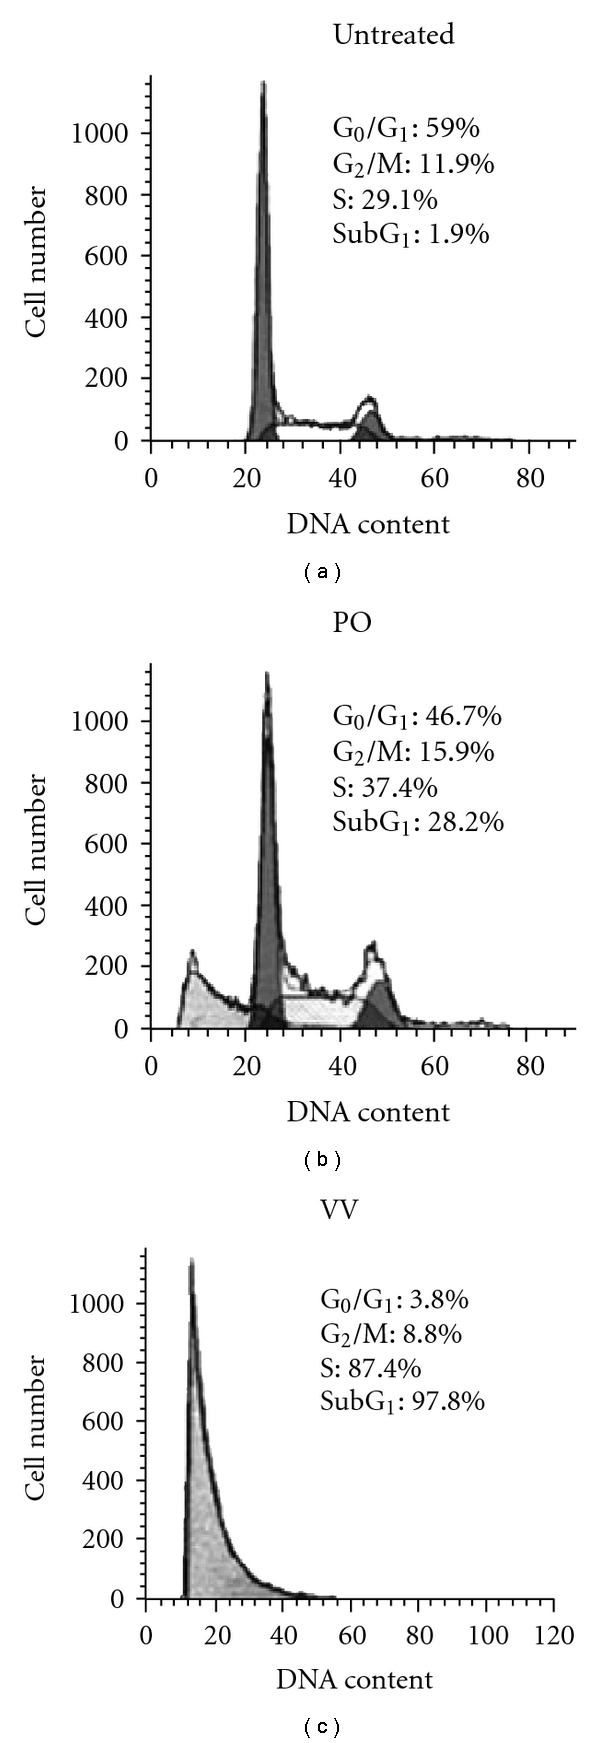
Figure 3.

DNA damage analysis of PO and VV protein extract-treated SW480 cells. SW480 cells were treated with PO and VV protein extracts (100 μg mL−1) for 24 h. After treatment, cells were fixed and then stained with propidium iodide, followed by flow cytometric analysis. Data in each panel show the percentages of cells in SubG1 (DNA-damaged cells), G1, S and G2/M phases of the cell cycle. These experiments were performed at least three times and a representative experiment is presented.
