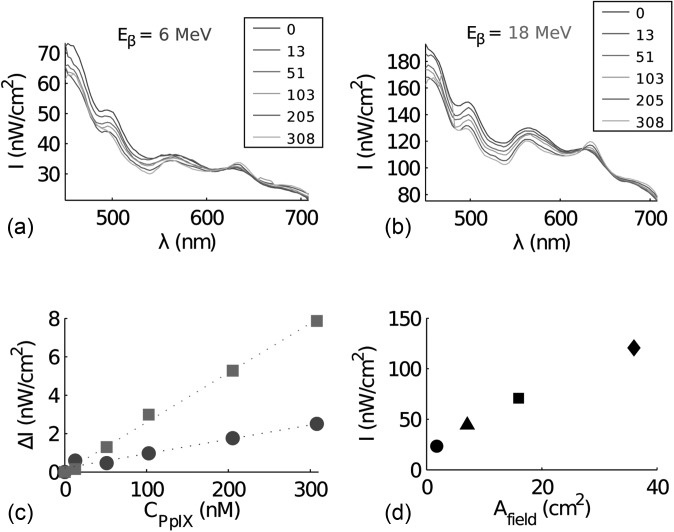
Figure 5.
Fluorescence spectra induced by an electron beam. The intensity (I) as a function of wavelength (λ) collected from the scattering phantom with increasing levels of protoporphyrin IX, induced by an electron beam at (a) 6 MeV and (b) 18 MeV. The legend specifies the PpIX concentrations in nM. In (c) the incremental intensity (ΔI) at 635 nm is seen as a function of protoporhyrin IX concentration, where (•) is electron energy 6 MeV (R2 = 0.96) and (▪▪) 18 MeV (R2 = 0.99). In d) the intensity at 635 nm is plotted as a function of field size of the electron beam at 18 MeV where (•) circular field with diameter 1.5 cm, (▴) circular field with diameter 3 cm, (▪) square field size of size 4 × 4 cm2and (♦) square field size of size 6 × 6 cm2.

