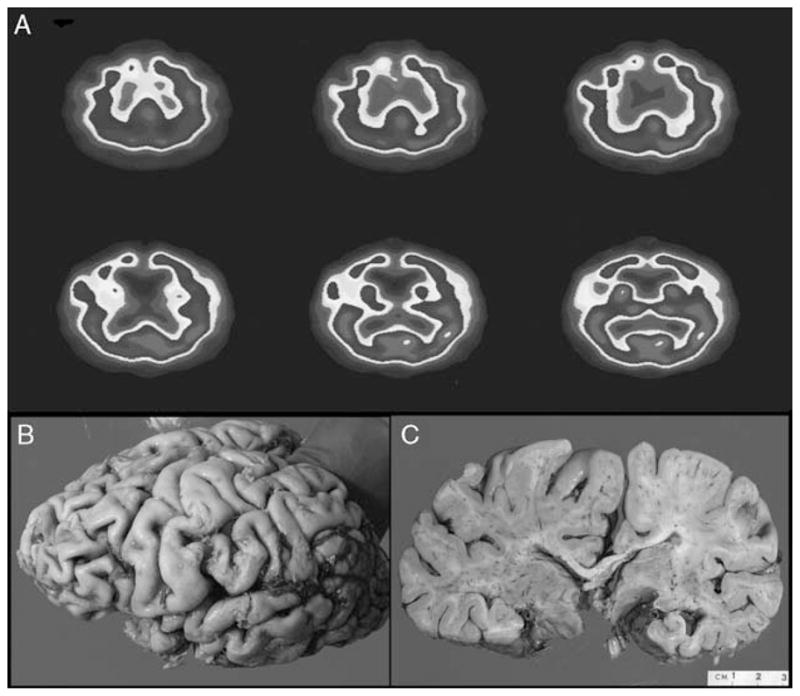
FIGURE 2.

A, Axial SPECT scan showing frontal and temporal hypoperfusion, right greater than left. B, Brain at autopsy showing marked atrophy of the frontal and anterior temporal lobes. C, Coronal section showing temporal lobe atrophy with relative sparing of bilateral hippocampi. SPECT indicates single photon emission computed tomography.
