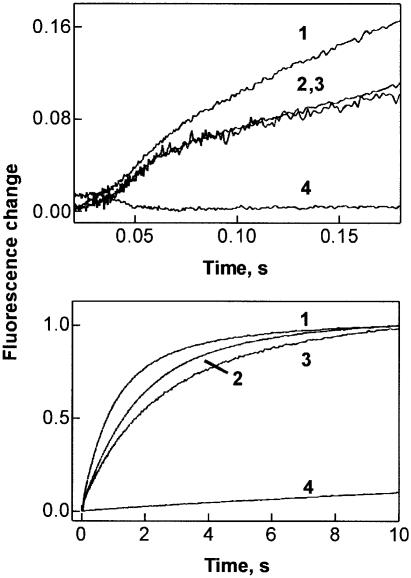
Fig. 2. Kinetics of Pi release from EF-G following GTP hydrolysis on the ribosome. Upper panel, short time window; lower panel, long time window. EF-G or EF-G mutants (2 mM, final concentration) were rapidly mixed with ribosomes (0.2 mM) and liberated Pi was monitored by the fluorescence of MDCC-labeled PBP (Materials and methods). 1, wild-type EF-G; 2, R59K; 3, R59M; 4, R29A.

An official website of the United States government
Here's how you know
Official websites use .gov
A
.gov website belongs to an official
government organization in the United States.
Secure .gov websites use HTTPS
A lock (
) or https:// means you've safely
connected to the .gov website. Share sensitive
information only on official, secure websites.
