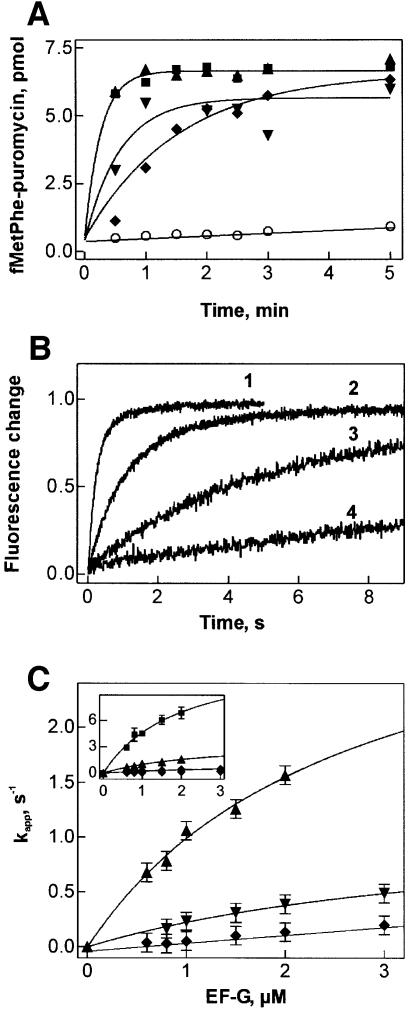
Fig. 5. Translocation activity of EF-G R59 mutants. (A) Multiple-turnover translocation. EF-G wt (squares), R59K (upward triangles), R59M (downward triangles), R59A (diamonds), no EF-G (circles). (B) Single-round translocation. Time courses were evaluated by single-exponential fitting with the kapp values given. 1, wild-type EF-G(4.4 s–1); 2, R59K (0.8 s–1); 3, R59M (0.17 s–1); 4, R59A (0.04 s–1). (C) Dependence of kapp of translocation on the concentration of mutant and wild-type (inset) EF-G. For kapp values measured at 2 µM factor see Table II. Symbols are as in (A). Experiments were performed as in Figure 4.

An official website of the United States government
Here's how you know
Official websites use .gov
A
.gov website belongs to an official
government organization in the United States.
Secure .gov websites use HTTPS
A lock (
) or https:// means you've safely
connected to the .gov website. Share sensitive
information only on official, secure websites.
