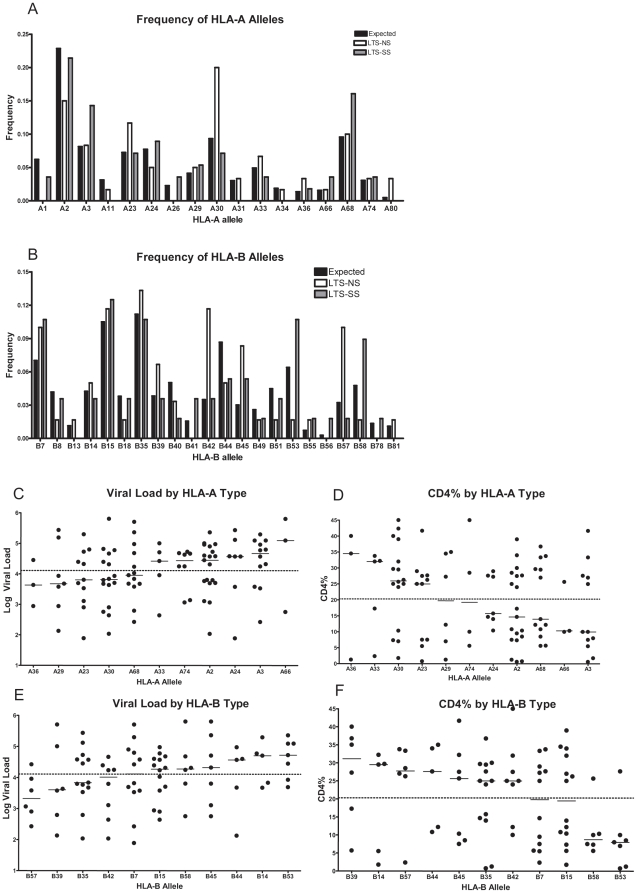
Figure 2. Distribution of HLA class I alleles in study Cohort.
The frequency of expression of HLA class I A alleles (A) and B alleles (B) among the two progression groups in the cohort was compared to the expected frequency in a Hispanic and African American cohort (see methods). Associations between HLA Class I alleles and clinical characteristics are shown in panels C–F. Associations between log viral load (LCL) of all subjects and class I HLA-A alleles (C) and B alleles (D), are ordered from lowest LVL to highest. Associations between CD4% values and HLA Alleles (E) and B alleles (F) are ordered from highest CD4% to lowest. The solid line in each column is the median value for that HLA allele. The dotted line is the median value of the total cohort.

