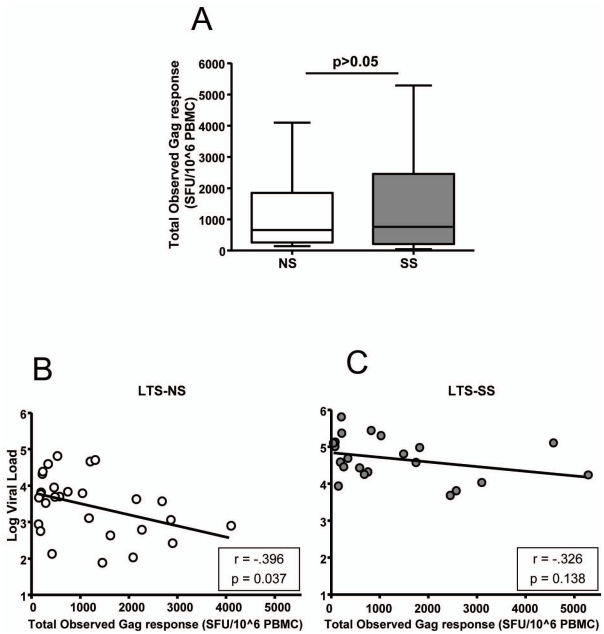
Figure 3. Association between Gag specific responses and disease progression.
The magnitude of the total observed Gag specific responses (the sum of all the epitope- specific responses) is compared between the two groups in panel A. Correlations between LVL and the magnitude of the total observed Gag response are displayed for both progression groups in panels B and C.

