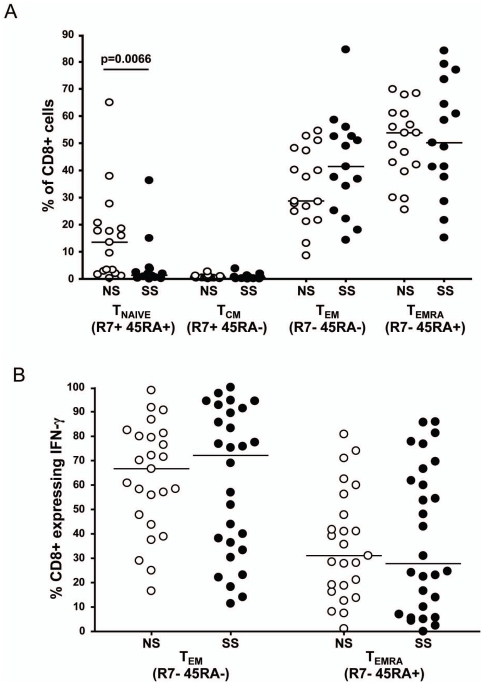
Figure 6. Comparison of differentiation profiles of Gag specific effector CD8+ T cells between progression groups.
All Gag specific responses are shown in panel A. Only immuodominant responses (the response with the highest magnitude for each individual) are shown in panel B. The line in each column represents the median value. The differentiation phenotype is referenced beneath each column.

