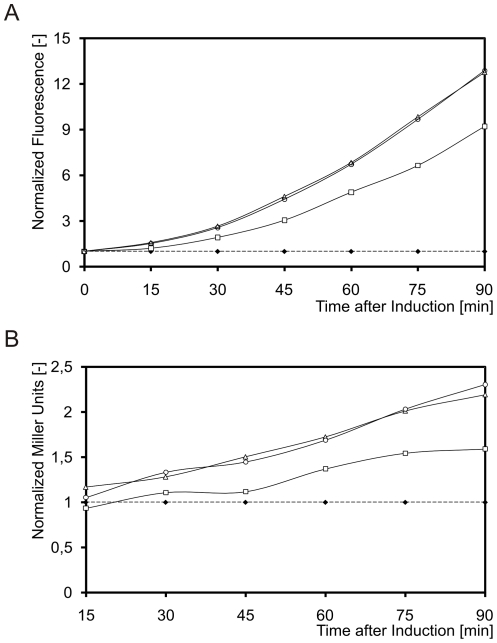
Figure 3. The CesSR response is proportional to, and follows in time, the level of production of BcaP-GFP-H6.
The level of BcaP-GFP-H6 produced by L. lactis NZ9000 (pNZbcaP-GFP-H6; pAB0169) was modulated by inducing the strain at an OD600 = 0.5 with different amounts of the inducer nisin A: 0 ng/ml (control; dotted line and full diamonds), 0.25 ng/ml (empty squares), 2.5 ng/ml (empty triangles), 25 ng/ml (empty circles). A. Average BcaP-GFP-H6 fluorescence per cell. B. β–galactosidase activity specified by the Pllmg_0169-lacZ fusion in plasmid pAB0169. In both A and B values were normalized to the uninduced culture in both figures.

