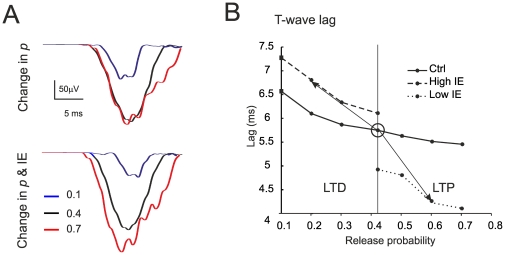
Figure 8. Simulations of the effects of long-term synaptic plasticity -II.
(A) Simulated LFP changes in vivo obtained by changing release probability (p) alone (top) or together intrinsic excitability (IE) (bottom). The rising phase of the LFP is shown on expanded time-scale. (B) The plot shows the delay changes caused by p in T-wave. The three different curves represent levels of IE (low, normal and high). Note that appropriate LTP and LTD changes like those observed experimentally occur when both p and IE change bidirectionally around the control value. Each trace is the average of 15 simulations.

