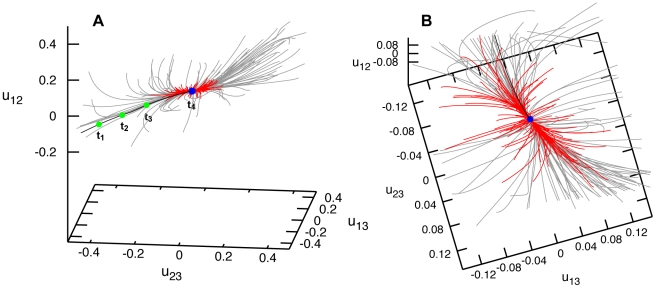
Figure 6. Relaxation dynamics of XPD helicase.
Panels (A) and (B) show the relaxation pattern as a set of 100 trajectories in the space of normalized relative distance changes  and
and  between the three labels. Each trajectory starts from a different initial deformation that has been generated by applying random static forces globally distributed to all network beads (grey trajectories) or restricted to the beads of the ATP binding site (red trajectories). In panel (B), a different viewpoint is chosen and the scales are smaller.

