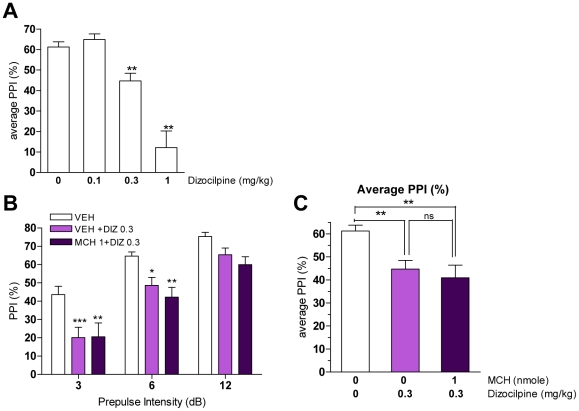
Figure 4. MCH effects on dizocilpine-induced PPI deficits in mice.
A. Effect of dizocilpine (0, 0.1, 0.3, 1 mg/kg) on PPI (**p<0.01 vs. VEH, one-way ANOVA, Dunnett's test; n = 5–13). Values represent average of % PPI upon three prepulse intensities ± SEM. B. PPI levels after MCH pretreatment (0, 1 nmole) in dizocilpine (0, 0.3 mg/kg)-treated mice (*p<0.05, **p<0.01, ***p<0.001 vs. VEH, two-way ANOVA with Bonferroni test; n = 8–12). Values represent mean % PPI ± SEM. C. Average of PPI value after MCH pretreatment on dizocilpine injections (**p<0.01 vs. VEH, ns p>0.05 vs VEH+DIZ0.3, one-way ANOVA with Bonferroni test; n = 8–12). Values represent average of % PPI from three prepulses ± SEM.

