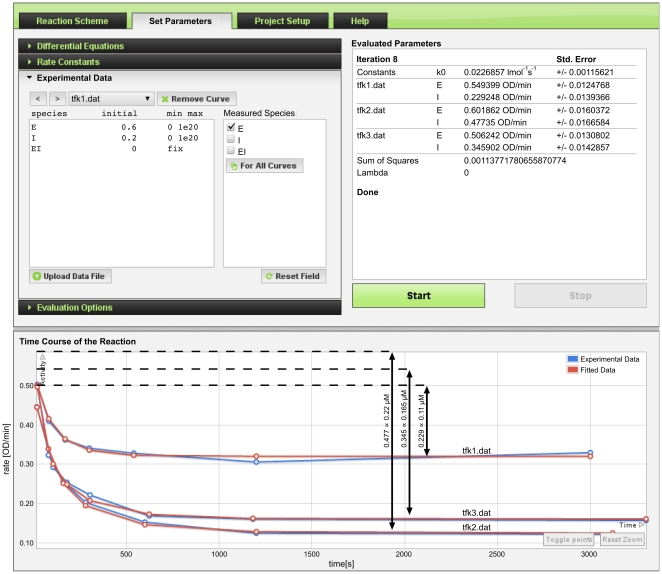
Figure 4. Converged results of parameter fitting for enzyme active site titration experiment.
Initial concentrations of enzyme E and inhibitor I for progress curve files tfk1.dat, tfk2.dat, tfk3.dat (Experimental Data panel shows tfk1.dat) are fitted in the interval of [0, 1020]; the initial concentration of EI is zero and fixed; the checkbox “E” is checked under Measured Species, which signifies that E is the measured quantity and the progress curves below represent the time course of its residual activity. The respective units of the residual activity in the Y-axis are OD/min and the units of time in X-axis are seconds. Fitted rate constant k0 and initial values of E and I at three different concentrations of I are displayed under the Evaluated Parameters in the upper right corner panel, the experimental progress curves are blue and the fitted curves are red as shown in Time Course of the Reaction chart at the bottom panel of the screen. The arrows mark the difference between the inital value and the plateau.

