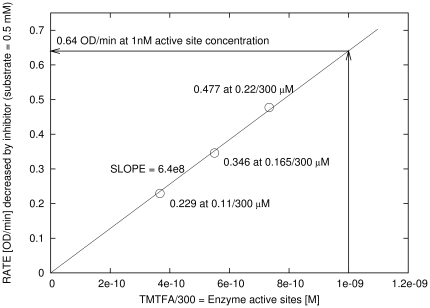
Figure 5. Normalization curve for the determination of active site concentration from enzyme activity.
X-axis represents the concentration of added TMTFA corresponding to actual enzyme concentrations after 300 times delution. Y-axis represents the difference between the initial enzyme activity and the activity at plateau caused by the presence of experimental TMTFA concentration. The concentration of the substrate in all activity determinations was 0.5 mM.

