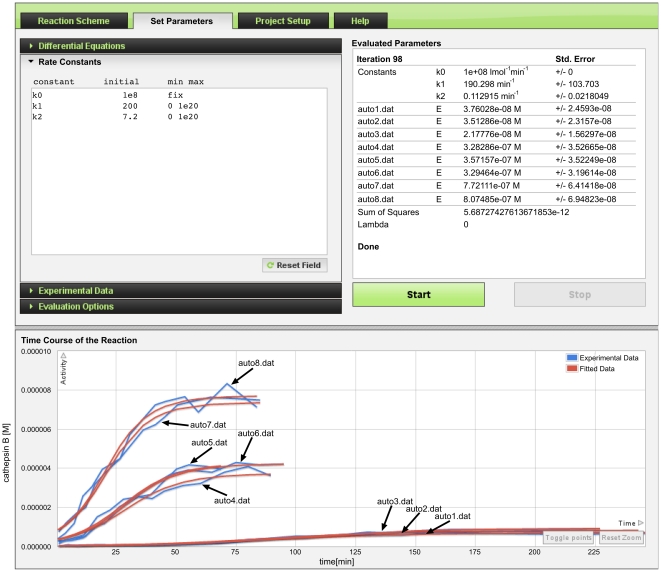
Figure 7. Autoactivation of procathepsin B.
The data originally presented in [11] were used. The total amount of protein was determined by Pace et al. [13] and used as a fixed value for each substrate/precursor concentration. The initial values of ES is zero and E is fitted in the interval [0, 1]. The initial value of rate constant k0 is set to diffusion rate value of 108 M−1 min−1 and fixed, while initial values of k1 and k2 are 200 min−1 and 7.2 min−1 respectively, and fitted in the interval of [0, 1020]. The sum of free active enzyme (E) and the instantaneusly dissociated complex (ES) is the measured species. Y-axis represents the concentration of cathepsin B in molar concentration and the X-axis represents time in minutes. The final estimated values of rate constants and initial concentrations of active enzyme portion for each individual curve are displayed under the Evaluated Parameters.

