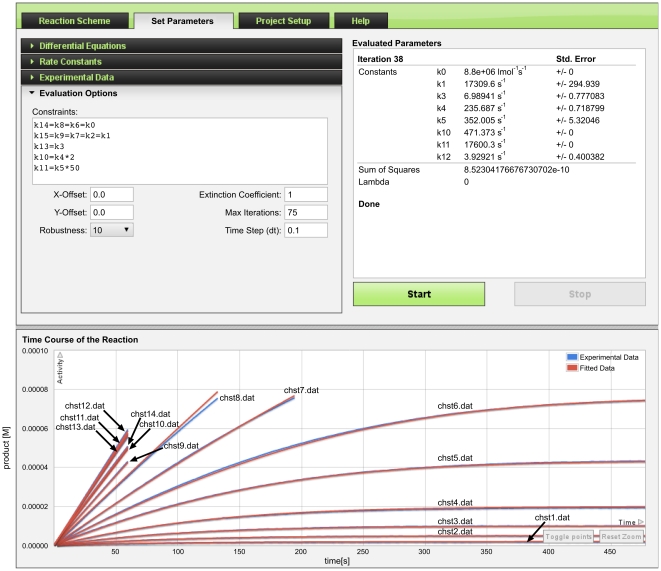
Figure 9. Converged results of parameter fitting for inhibition of cholinesterase.
Fitted rate constants k1, k3, k4, k5, k10, k11, k12 are displayed under the Evaluated Parameters. k0 is fixed at 8.8·106 s−1. ENZO allows, if necessary, for constraining several rate constants, thus simplifying the fitting and speeding up the evaluation process (k14 = k8 = k6 = k0, k15 = k9 = k7 = k2 = k1, k13 = k3, k10 = 2k4, k11 = 50k5, where k14, k8, k6, k0 are second order while others are first order rate constants). For all progress curves, the initial concentrations of SES, SE, EAS, ES, SEAS, P, ES, SEA are fixed to zero and not fitted. E is fixed to 2.6 nM as independently determined by active site titration. For the progress curves chst1.dat to chst14.dat, S is fixed to 2 µM, 5 µM, 10 µM, 20 µM, 4.35 µM, 7.63 µM, 0.16 mM, 0.5 mM, 1 mM, 2 mM, 5 mM, 10 mM, 20 mM and 5 mM respectively. P is the measured species. Y-axis shows the product in molar concentration and X-axis shows the time in seconds.

