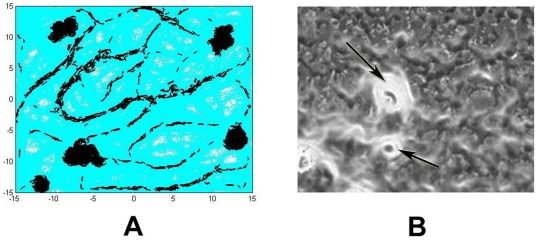
Figure 3. Aggregation center formation of wild-type cells at the end of 12 hours under developmental conditions.
(A) Simulation image using all five parameters with values listed in Table 1. Simulation uses periodic boundary conditions and starts with 5000 cells for 12 hours (2160 simulation time steps). (B) Experimental image showing early aggregation centers at 12 hours after initiation of starvation. Cells are shown in dark grey and EPS in white. Arrows show aggregation centers formed by large number of cells with high concentration of EPS. At locations with high EPS concentration, bright white color overrides black in the view of microscope.

