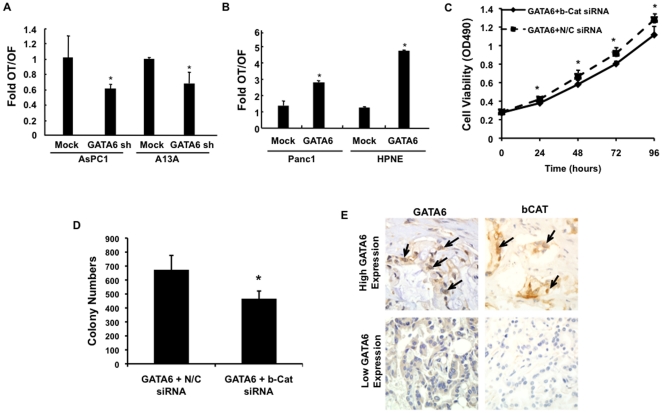
Figure 4. GATA6 Overexpression Correlates with Canonical Wnt Signaling.
(A) Wnt signaling activity in AsPC1-GATA6sh and A13A-GATA6sh cells based on TOPFLASH assay. Luciferase activity is represented as the ratio of OT to OF levels in cells with GATA6 knockdown relative to that of mock-transfected cells. (B) Wnt signaling activity in Panc1-GATA6 and HPNE-GATA6 cells determined by TOPFLASH assay. Luciferase activity is represented as the ratio of OT to OF levels in GATA6 transfected cells relative to that of mock-transfected cells. (C and D) Panc1-GATA6 cells were transiently transfected with ß-catenin or mock shRNA and (C) cell proliferation or (D) colony formation determined. All experimental data shown represents the summary three independent experiments. *, p<0.05; **, p<0.01. (E) Immunolabeling patterns of GATA6 and ß-catenin protein in two representative PDAC tissues. Arrows indicate nuclear labeling of both GATA6 and ß-catenin in serial sections of the same cancer tissue. By contrast, the PDAC sample with low GATA6 expression also shows no expression of ß-catenin.

