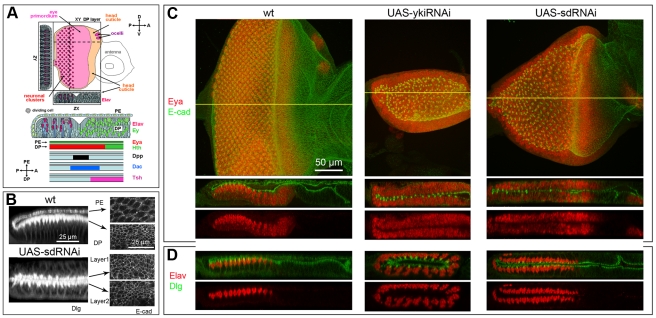
Figure 1. Loss of Yki or Sd changes the fate map of the eye disc.
In all figures: posterior is on left; Gal4 driver is Act>IC>Gal4 unless otherwise stated; UAS transgenes used are as marked in panels; magnification shown in first panel applies to all panels in figure unless otherwise marked; XY images show projections of all Z optical planes unless otherwise stated; ZX and ZY images of disc scans were edited to display the selected regions of the discs marked by yellow lines in the XY view; colors have been chose to optimize image quality and do not always reflect the corresponding detection channel; for precise genotypes and temperature of crosses see Table S1. A) Schematic diagram of developing eye disc at the L3 stage with expression pattern of molecular markers used in this work. Larger image is provided in Fig. S1A. B) In the wt (top), PE cells are squamous and DP cells are columnar. In sd-RNAi-expressing discs (bottom), both cell layers display the columnar appearance of the pseudostratified DP monolayer. As shown by the uneven staining of the apical versus basal portions of the cell membranes and the position of the neuronal nuclei shown in panel D, the polarity of the cells is not disrupted; the apical side faces the disc lumen in all cases. C, D) wt (left), yki-RNAi (middle) and sd-RNAi (right) discs; C) L3 discs stained for the RDF Eya (red) to show retinal cells and the apical membrane marker E-cadherin (green) to highlight cell morphology. Mutant discs display two DP-like retina forming cell layers. D) L3 discs stained for the neuronal marker Elav (red) and the membrane marker Dlg (green). Mutant discs contain developing mirror-image, neuronal arrays; in both cell layers, neurons begin to form at the posterior and rows are added progressively expanding the ommatidial field towards the anterior.

