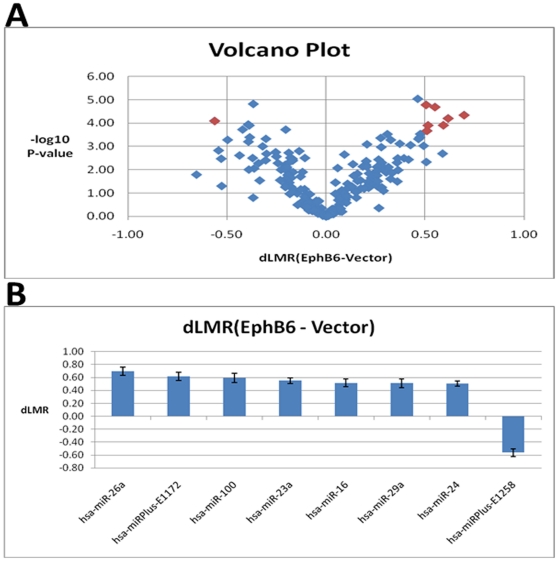
Figure 2. Significantly altered miRNAs in EphB6 transfected MDA-MB-231 cells.
A. Volcano plot indicating miRNAs with dLMR values greater than 0.5 or less than −0.5 at a p-value of less than 0.001. The symbols in red color represent the miRNAs meeting the cut-off values. B. Variations in the values of delta LogMeadianRatio (dLMR) for selected miRNAs are indicated by standard deviations among three replicates.

