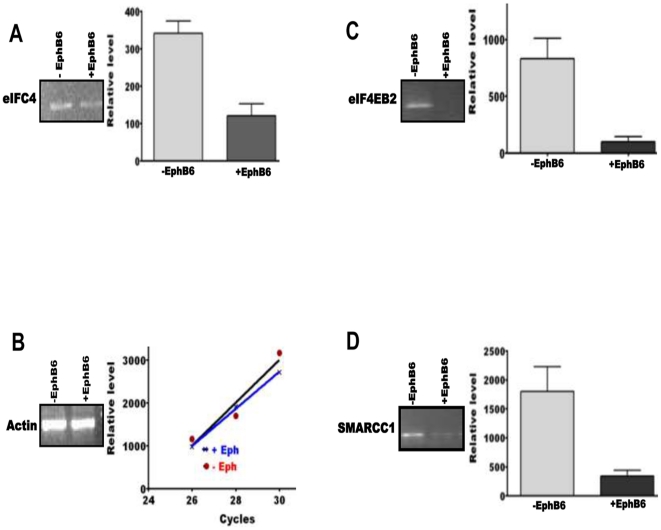
Figure 6. Amplification of mRNAs targeted by various miRNAs.
Each panel shows a representative gel picture for the transcript levels in empty vector-transfected (left lane) and EphB6-transfected (right lane) MDA-MB-231 cells. The bar diagram on the right shows quantification of three gels for the levels of transcripts. The Y-axis represents arbitrary units of intensity. Empty vector-transfected and EphB6-transfected MDA-MB-231 cells are designated as −Eph and +Eph. The transcript designations are indicated in each panel. The graph shows linear and comparable amplification of actin transcript in RNA isolated from empty vector-transfected and EphB6-transfected MDA-MB-231 cells.

