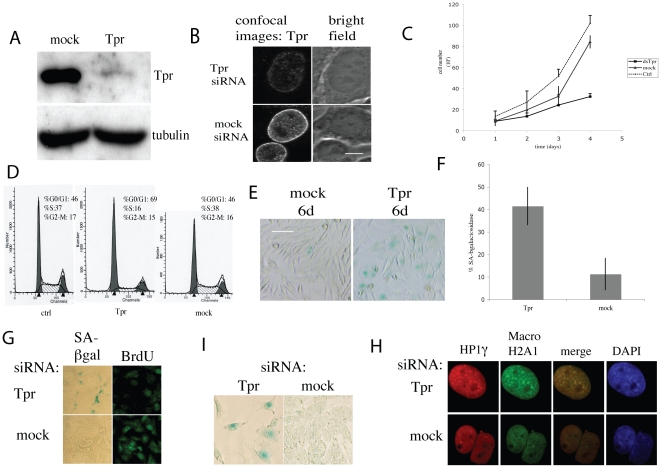
Figure 1. Cell cycle effects of Tpr depletion in HeLa cells.
HeLa cells seeded in 24-well plates at 5 10−4 cells per well were treated with Tpr or mock siRNAs. 1A. 48 hours after siRNA treatment as indicated on top of the figure, a cell extract was prepared and analyzed by western blotting using anti-Tpr Mab 203-37; tubulin was used as loading control. 1B. Bright field image (right panel) and confocal image (left panel) of HeLa cells labeled with an anti-Tpr monoclonal antibody after 2 days of transfection with Tpr or mock siRNA. Scale bar: 5 µm. 1C. Growth curve of HeLa cells transfected with Tpr, mock siRNA or not transfected: control (Ctrl). 1D. Representative FACS profiles of mock siRNA treated (left panel), Tpr siRNAs treated cells (center) and non-transfected cells or control (right). Ethanol-fixed cells were incubated with PI and analyzed by FACS for ploidy. Cell number is represented on the vertical axis and DNA content on the horizontal axis. G0–G1 and G2-M phases are represented as first and second peaks starting from the vertical axis, respectively. The intermediate striped domain corresponds to the S phase. 1E. Induction of senescence: cells were plated at low density and treated with Tpr or mock siRNAs. After 6 days, cells were fixed and stained for SA-β-gal activity at pH 6.0. Scale bar: 20 µm. 1F. Quantification of SA-β-gal positive cells in cultures depleted of Tpr and stained for SA-β-gal activity at pH 6.0. 1G–1H. U2OS cells were transfected with Tpr or mock siRNAs. 1G: After 6 days the cells were fixed and stained for BrdU incorporation and SA-β-gal activity at pH 6.0. Scale bar: 15 µm. 1H: After 6 days, the cells were labeled with anti-HP1γ and anti-MacroH2A antibodies and DAPI. Scale bar: 5 µm. 1I: A375 cells were transfected with Tpr or mock siRNAs. After 6 days the cells were fixed and stained for SA-β-gal activity at pH 6.0. Scale bar: 15 µm.

