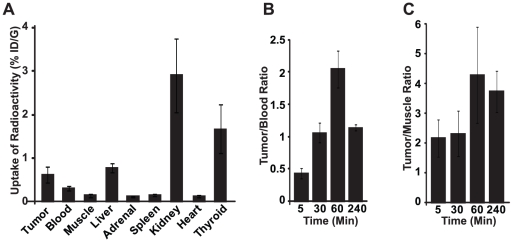
Figure 5. Tissue biodistribution of [125I]IBMF3 in MDA MB-435 tumor bearing mice.
Mice (n = 4 per time interval) were injected via tail vein with [125I]IBMF3 and tissues were harvested for radioactivity uptake. (A) Tissue distribution at 60 min post injection and reported as percent injected dose per gram of tissue (%ID/g). (B) and (C) represent the ratio of radioactivity in tumor to blood and tumor to muscle respectively at various time intervals. All the data are computed as mean +/− SEM.

