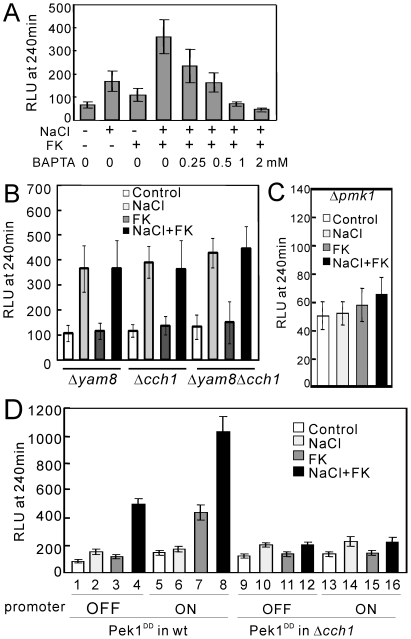
Figure 5. NaCl plus FK506 caused a synergistic cytoplasmic Ca2+ increase via the Cch1-Yam8 channel complex.
(A) The synergistic increase in the cytoplasmic Ca2+ level is derived from the extracellular medium. The experiment was performed as described in Figure 4, except that prior to the addition of FK506, various concentrations of BAPTA (0.25, 0.5, 1, and 2 mM) were added to chelate Ca2+ in the EMM medium. The histogram was calculated as described in the legend of Figure 4. (B) The cch1 and yam8 deletion abolished the synergistic increase in the cytoplasmic Ca2+ level. The Δyam8, Δcch1, or Δyam8Δcch1 cells harboring pKB6892 were cultured and assayed as described in Figure 4. The histogram was calculated as described in the legend of Figure 4. (C) The pmk1 deletion abolished the synergistic increase in the cytoplasmic Ca2+ level. The Δpmk1 cells harboring pKB6892 were cultured and assayed as described in Figure 4. The histogram was calculated as described in the legend of Figure 4. (D) Overexpression of the constitutively active Pek1 MAPKK stimulates the Cch1-Yam8-mediated Ca2+ influx. The wild-type or Δcch1 cells integrated with chromosomal pREP1-GST-Pek1DD were transformed with pKB6892, and the transformants were cultured in EMM containing 4 µM thiamine for 12 hours. Then the cells were collected and washed three times with EMM without thiamine. The washed cells were divided into two portions, one portion was cultured in EMM containing 4 µM thiamine, and the other portion was cultured in EMM without thiamine, and the cells were grown to exponential phase. The cytoplasmic Ca2+ level was monitored as described in Figure 4. “Promoter OFF” indicates that the expression of Pek1DD was repressed by the addition of 4 µM thiamine to the medium and “Promoter ON” indicates that the expression of Pek1DD was induced by the removal of thiamine from the medium. The histogram was calculated as described in the legend of Figure 4. The data represent the means ± standard deviations of RLU taken at 240 min from three independent experiments, and each sample was analyzed in duplicate.

