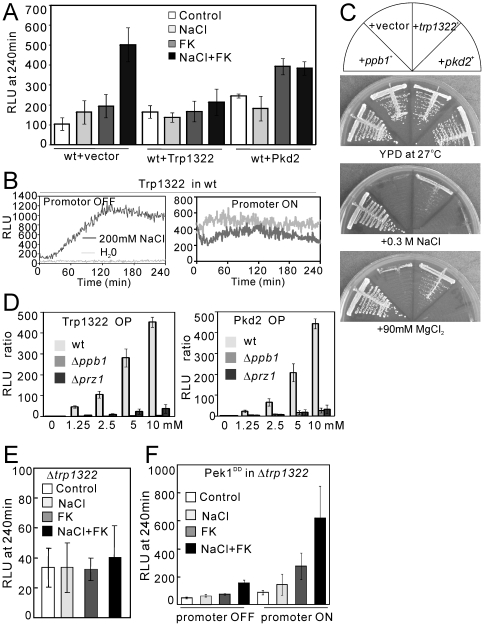
Figure 7. The role of Trp1322 in the regulation of calcium homeostasis in fission yeast.
(A) The overexpression of Trp1322 and Pkd2 abolished the synergistic effect of NaCl plus FK506. The KP3028 cells were transformed with the control vector, pREP1-GFP-Trp1322 or pREP1-Pkd2-GFP, then were cultured as described in Figure 2A, and were assayed as described in Figure 4. The histogram was calculated as described in the legend of Figure 4. (B) When Trp1322 was overexpressed, the high basal CDRE-reporter activity was significantly decreased by the addition of NaCl. Note the marked activation of the reporter activity by the same stimuli in non-induced cells (Promoter OFF, left pannel). The KP2755 (h− leu1 arg1 3×CDRE::luc(R2.2)::arg1+) cells were transformed with pREP1-GFP-Trp1322. The assay was performed as described in Figure 3B. The data shown are representative of multiple experiments. (C) The overexpression of trp1322 + gene suppressed the salts sensitivity of Δppb1 cells. The Δppb1 cells transformed with the control vector, pREP1-GFP-Trp1322 or pREP1-Pkd2-GFP were streaked onto the plates as indicated and then incubated for 4 days at 27°C. (D) The effect of the overexpression of Pkd2 or Trp1322 on the cytosolic Ca2+ level upon the addition of extracellular calcium in Δppb1 and Δprz1 cells. The KP3028 (wild-type), KP3750 (Δppb1) or KP3688 (Δprz1) cells transformed with the control vector, pREP1-GFP-Trp1322 or pREP1-Pkd2-GFP, respectively were cultured and assayed as described in Figure 2A. The RLU ratio was determined by dividing the peak RLU at 0 mM CaCl2 by the peak RLU at 1.25, 2.5, 5, and 10 mM CaCl2, respectively. The data represent the means ± standard deviations of RLU ratio from three independent experiments, and each sample was analyzed in duplicate. (E) The deletion of trp1322 + gene suppressed the synergistic effect of NaCl plus FK506. The Δtrp1322 cells harboring pKB6892 were cultured and assayed as described in Figure 4. The histogram was calculated as described in the legend of Figure 4. The data represent the means ± standard deviations of RLU taken at 240 min from three independent experiments, and each sample was analyzed in duplicate. (F) Overexpression of the constitutively active Pek1 MAPKK also stimulates Ca2+ influx in Δtrp1322 cells. The Δtrp1322 cells integrated with the chromosomal pREP1-GST-Pek1DD were transformed with pKB6892, and the transformants were cultured in EMM with the addition of 4 µM thiamine for 12 hours. Then the assay was performed as described in the legend of Figure 5D. The histogram was calculated as described in the legend of Figure 4. The data represent the means ± standard deviations of RLU taken at 240 min from three independent experiments, and each sample was analyzed in duplicate.

