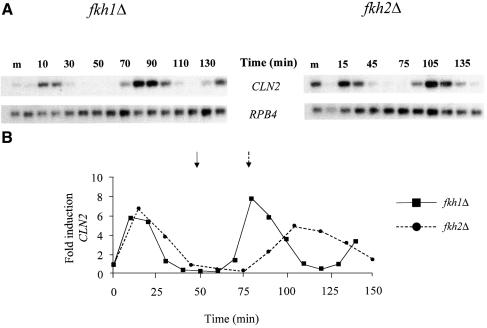
Fig. 3. Cell cycle expression of the CLN2 gene. (A) Northern blot analysis of RNA isolated from α-factor-synchronized cultures of the fkh1Δ and fkh2Δ strains using probes specific for the CLN2 and RPB4 transcripts. Following release from the α-factor block, RNA was isolated from cells of the fkh1Δ and the fkh2Δ strain at 10 and 15 min intervals, respectively. The first lane on each blot contains RNA isolated from midlog (m) cultures of each strain. (B) The panel below the northern blot shows the fold induction of CLN2 expression. Samples were first quantitated relative to the RPB4 loading control, then fold induction during the cell cycle was calculated relative to the time 0 value for each strain. The arrows indicate when maximum budding was achieved in the first cycle of the fkh1Δ strain (solid arrow) and the fkh2Δ strain (dotted arrow) following α-factor release.

An official website of the United States government
Here's how you know
Official websites use .gov
A
.gov website belongs to an official
government organization in the United States.
Secure .gov websites use HTTPS
A lock (
) or https:// means you've safely
connected to the .gov website. Share sensitive
information only on official, secure websites.
