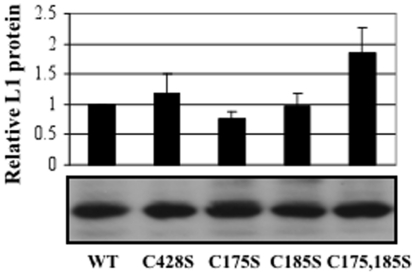
Figure 3. Expression of L1 in wild-type and mutant 10 day tissues.
Western blot analyses of equal volumes from WT, C428, C175, C185S, and C175,185S 10-day virus preparations. A representative Western blot is shown below while a graph depicting the relative L1 protein expression per viral preparation via densitometry is shown above. The results are means and standard deviations from three independent experiments.

