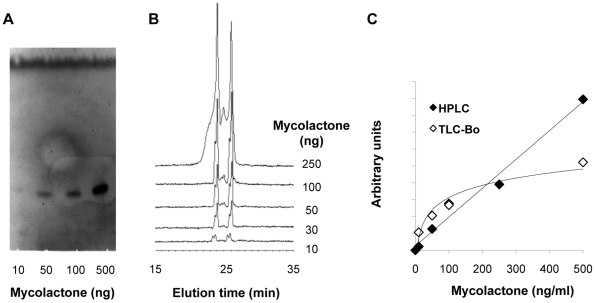
Figure 1. Comparison of the performances of the TLC-Fluo and HPLC approaches for mycolactone quantitative detection.
A representative picture of the fluorescent signals and elution peaks obtained for mycolactone (10–500 ng) detection by TLC-Fluo (A) and HPLC (B) are shown, with the corresponding standard curves (C). Arbitrary units correspond to fluorescence intensity of the mycolactone band (TLC-Fluo) and area of the mycolactone elution peak (HPLC). Similar results were obtained in at least three independent experiments.

