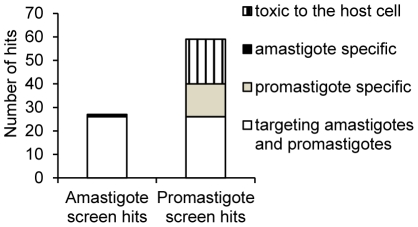
Figure 3. Number of hits identified with the intracellular amastigote and the promastigote primary screens.
White bar: number of compounds identified in both screens. Light grey and black bars: number of compounds specifically active against promastigotes and intracellular amastigotes respectively. Hatched bar: number of compounds active against the promastigote stage but determined as toxic against THP-1 host cell in the intracellular amastigote screen.

