
Figure 2. Effect of celecoxib in TRAMP-C2-GFP prostate cancer cells.
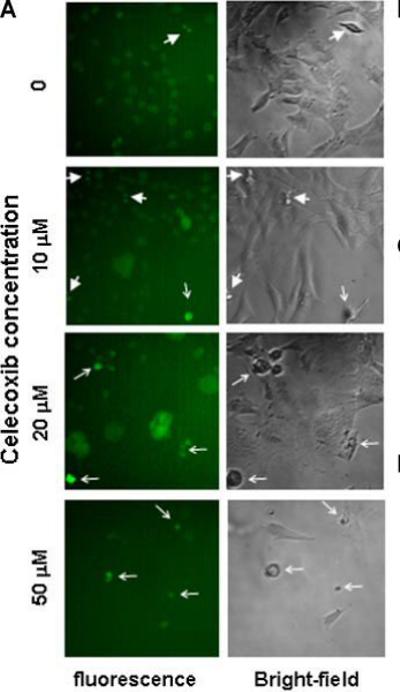

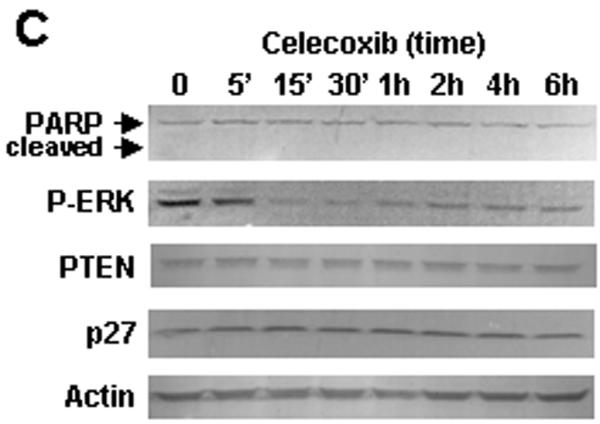

Panel A: Bright field microscopy (right) and fluorescence microscopy (left) of TRAMP-C2-GFP cells treated with increasing doses of Celecoxib for 48 hrs. Thick arrows point to mitotic cells; thin arrows point to dead cells. Panel B: Cells were treated with the indicated concentrations of celecoxib for 24 hrs. Cells were detached using trypsin, fixed, and co-stained for phospho-H3 (alexa-fluor 488) and DNA content (propidium iodide). The graph shows the proportion of cells in mitosis as compared to control, determined by flow cytometry on Facscan (BD Biosciences). Panel C: TRAMP-C2-GFP cells were treated with 40 μM celecoxib for the indicated times. Cells were lysed and protein expression was analyzed by western blot. Blot membranes were stripped and reprobed using the indicated antibodies. P-ERK: phosphorylation-specific antibodies to ERK. Panel D: TRAMP-C2-GFP cells were incubated in medium with or without androgen and treated with increasing concentrations of celecoxib for 48 hrs before cell counting. Results are expressed relative to untreated cells grown in medium containing androgen, and are means ± SEM of 3 separate experiments, each done in biological triplicate.