
Figure 8.
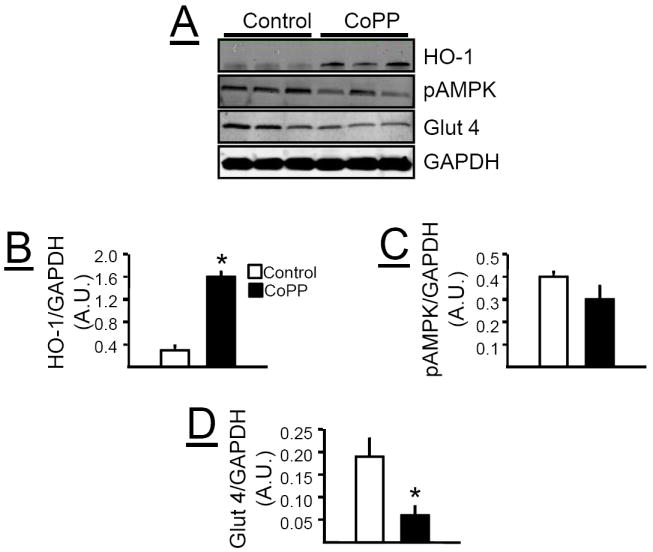
A) Representative Western blots from muscle of control and CoPP treated loxTB mice. B) Levels of HO-1 protein. C) Levels of pAMPK. D) Levels of glucose transporter 4 (Glut 4). * =P< 0.05 as compared to corresponding value in non-CoPP treated mice, n=6/group.