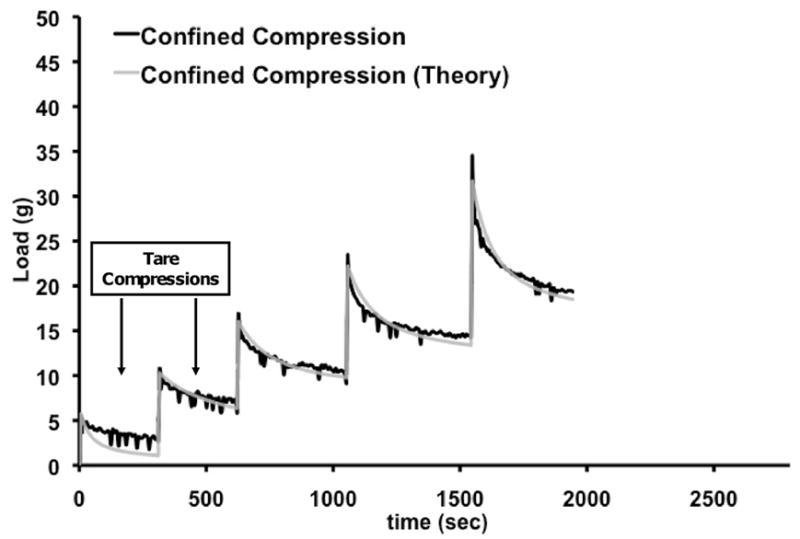
Figure 3.

Response of scaffold to stress-relaxation tests in confined and unconfined configuration of a representative construct. The experimental data and theoretical fit as per the biphasic theory for the confined tests are illustrated. The first two ramps represent the 8% tare strain (applied in two 4% strain steps) and were not used for calculations.
