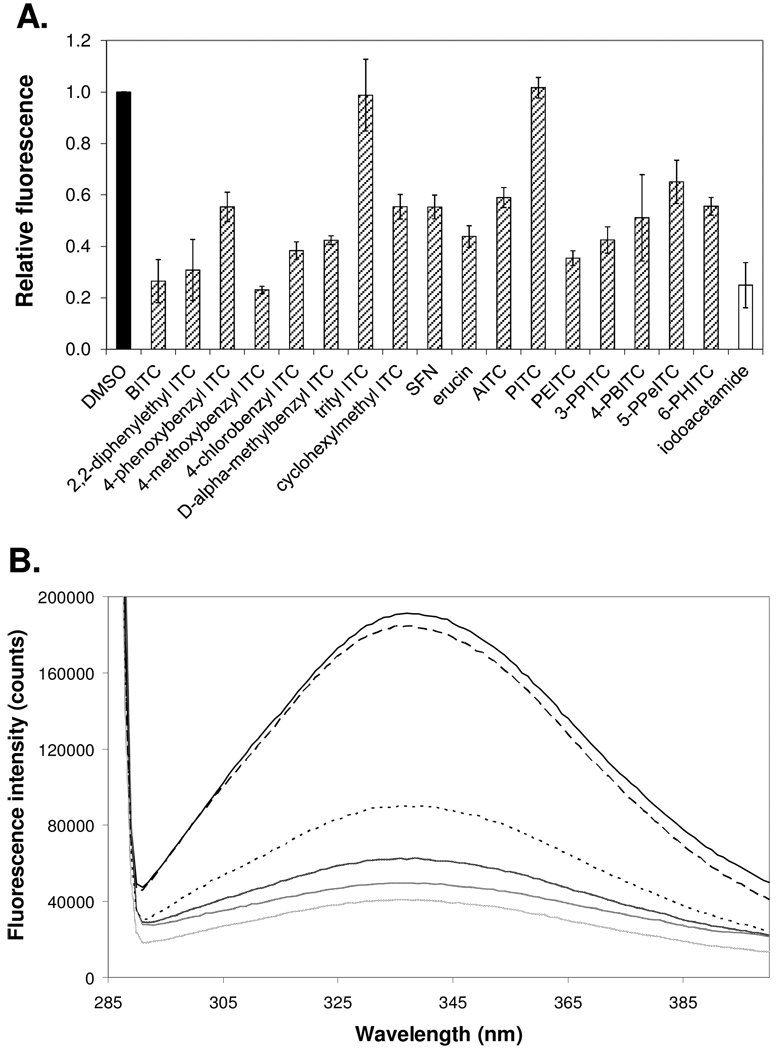
Figure 4. Cysteine binding in mutant (G245C) p53 DNA-binding domain by ITCs and subsequent conformational changes.
(A) Cysteine binding in the mutant (G245C) p53 DNA-binding domain by DMSO (control), ITCs or iodoacetamide, measured using a monochlorobimane fluorometric assay (λex 380 nm; λem 485 nm). (B) Intrinsic fluorescence emission spectra of mutant (G245C) p53 DNA-binding domain at 32°C (black solid line) incubated with, from highest intensity to lowest, DMSO (black large-dashed line), SFN (black small-dashed line), D-α-methylbenzyl ITC (dark grey line), BITC (medium grey line) or 4-phenoxybenzyl ITC (light grey line).

