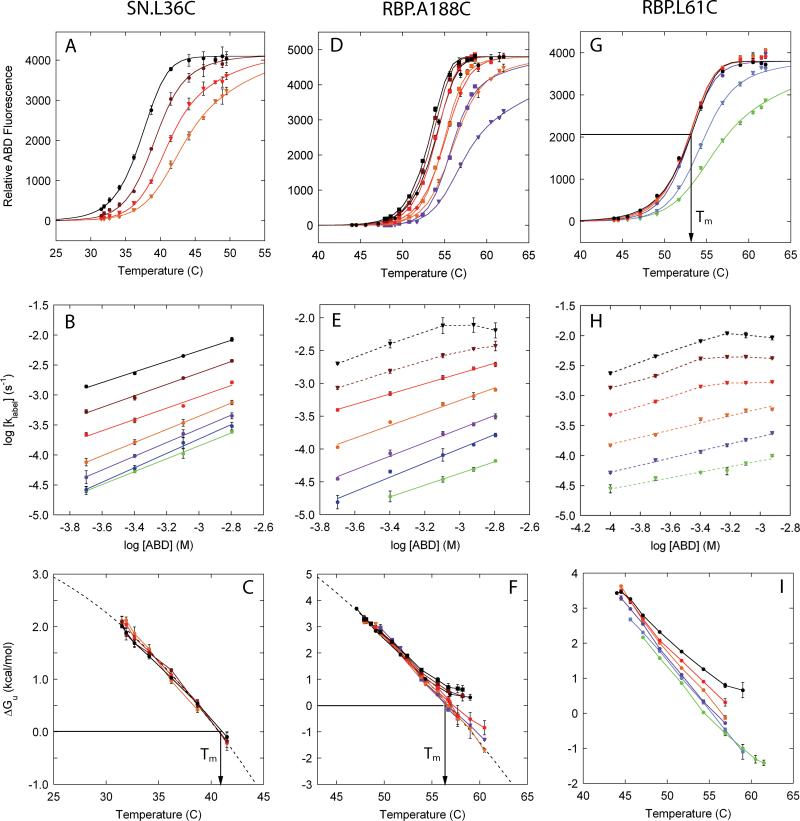
Figure 4. fQCR results for SN and RBP.
A, D, G: Temperature dependence of fractional labeling at single timed reaction endpoints monitored by ABD fluorescence fit with Eq. 16. Different curves represent different ABD concentrations or labeling times: SN.L36C, 300 s, ( ) 200 μM (
 ) 400 μM, (
 ) 800 μM and (
 ) 1600 μM; RBP.A188C, 300 s (closed circles and triangles) or 600 s (closed squares), (
 ,
,  ) 200 μM (
 ,
,  ) 400 μM, (
 ,
,  ) 800 μM, (
 ) 1200 μM, and (
 ,
,  ) 1600 μM; RBP.L61C, 300 s, (
 ) 100 μM (
 ) 200 μM, (
 ) 400 μM, (
 ) 600 μM, (
 ) 800 μM and (
 ) 1200 μM. B, E, H: Dependence of labeling rate constant on ABD concentration to identify EX2 conditions: SN.L36C, (
 ) 31.5°C, (
 ) 31.9°C, (
 ) 32.7°C, (
 ) 34.1°C, (
 ) 36.2°C, (
 ) 38.7°C and (
 ) 41.5°C; RBP.A188C, (
 ) 48.1°C, (
 ) 49.6°C, (
 ) 50.8°C, (
 ) 52.4°C, (
 ) 53.9°C, (
 ) 55.6°C and (
 ) 57.7°C; RBP.L61C, (
 ) 45.6°C, (
 ) 47.1°C, (
 ) 49.1°C, (
 ) 51.7°C, (
 ) 54.3°C and (
 ) 56.9°C. EX2 conditions (closed circles and solid lines) hold where the slope of the linear fit exceeds ~0.8. C, F, I: Transformation of fractional labeling to conformational free energy using Eqs. 13 and 5, and using the temperature dependence of kint obtained from Eq. 14. Gibbs-Helmholtz relationships (dashed line, Eq. 11 with ΔCp fixed at 3.0 kcal mol-1 K-1) can be fit to cases where EX2 conditions can be observed for at least some combinations of temperature and protein concentration (SN.L36C, RBP.A188C). Non-EX2 behavior is seen as peeling (F). The transformation of fi to ΔGU,i is done only for fi values between 0.02 and 0.95 to minimize artifacts associated with the experimental uncertainty encountered at very low and high levels of cysteine labeling.

