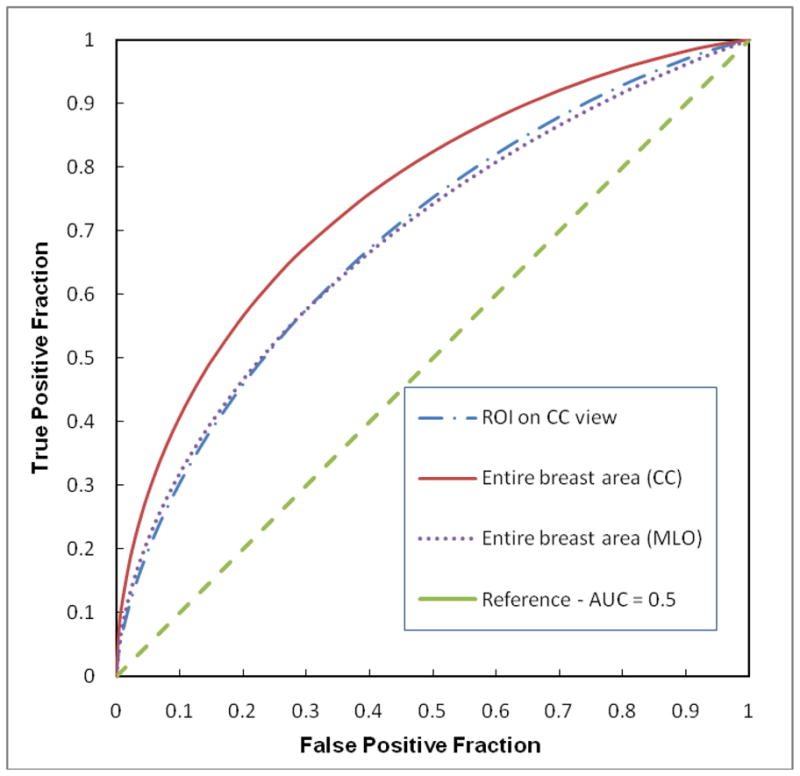
Fig. 3.

Comparison of three ROC curves generated by three ANNs trained using the features computed from the selected ROIs, the entire segmented breast areas depicted on either MLO view or CC view images. The areas under these three ROC curves are 0.690± 0.026, 0.688± 0.027, and 0.754± 0.024, respectively.
