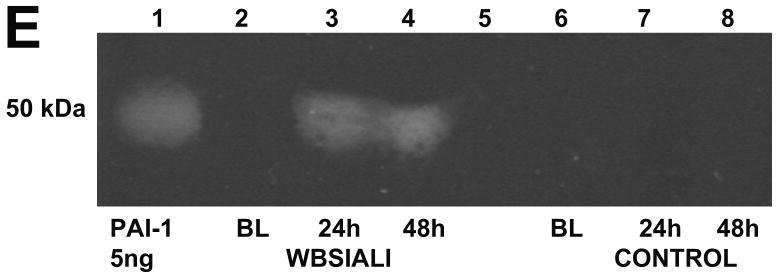
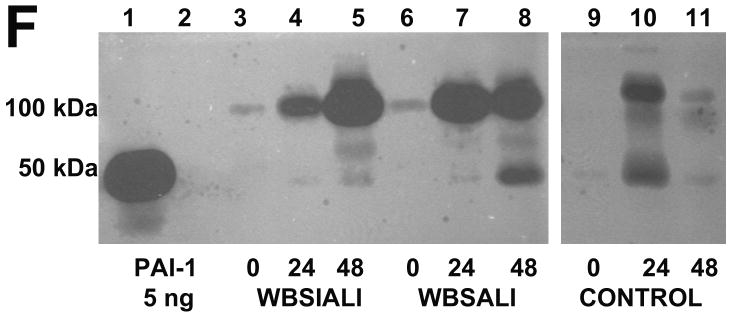
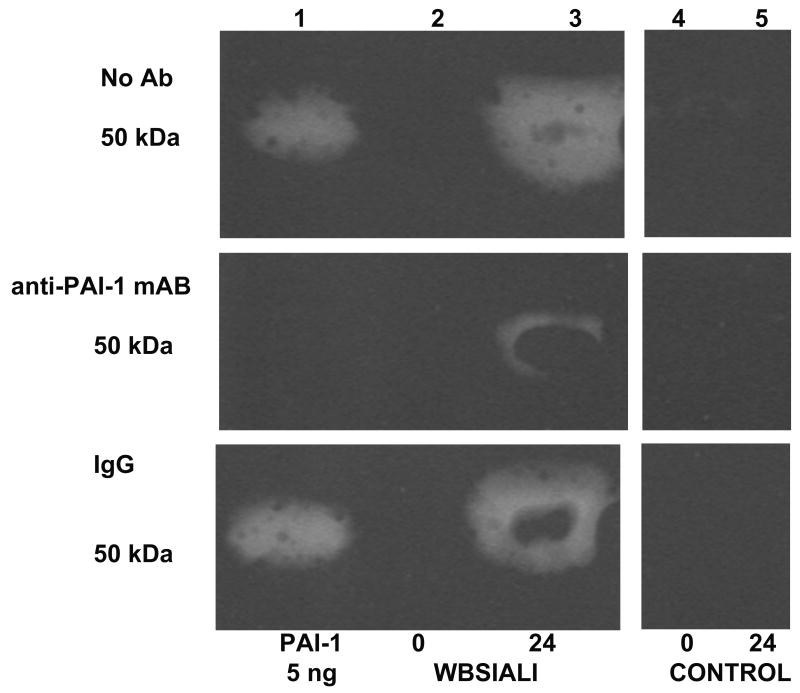
Figure 6.
A. A box plot of changes in plasminogen (PGN) activator activity with time. PGN activity (expressed in arbitrary units (AU) was determined in BAL of animals before (0 h) and after (24 h and 48 h) induction of SIALI (n=9, including 4 pigs ventilated with CMV and 5 with APRV); each value shown as a circle, ventilated controls (n=2) are shown in dark circles). Statistically significant differences (P<0.05) are indicated with asterisks, all samples done in duplicate analyses). B. A box plot of changes in the fibrinolytic activity as determined by release of radiolabeled fibrin in the same samples. Fibrinolytic activity was expressed in international units (IU) per ml of BAL. C and D. Changes in plasmin and urokinase amidolytic activities (expressed in arbitrary units (AU) determined in the same BAL samples. E. Reverse fibrin enzymography representative of the findings in BAL samples of all 9 48h SIALI and 2 control uninjured, mechanically ventilated pigs, showing the appearance of zones of resistance to fibrinolytic activity in BAL after ALI and absence of these bands in the BAL of timed-control pigs. F. Enzymographic analysis representative of the BAL findings in 48h SIALI pigs (n=9) and controls (n=2), showing increased PA-PAI-1 complexes at 100 kDa after injury. Zones of free uPA activity were also detectable in control and injured animals. G. Neutralization of zones of resistance to fibrinolysis in BAL of animals with SIALI by impregnation of the indicator gel with an antibody to human PAI-1 in reverse enzymographic analyses.


