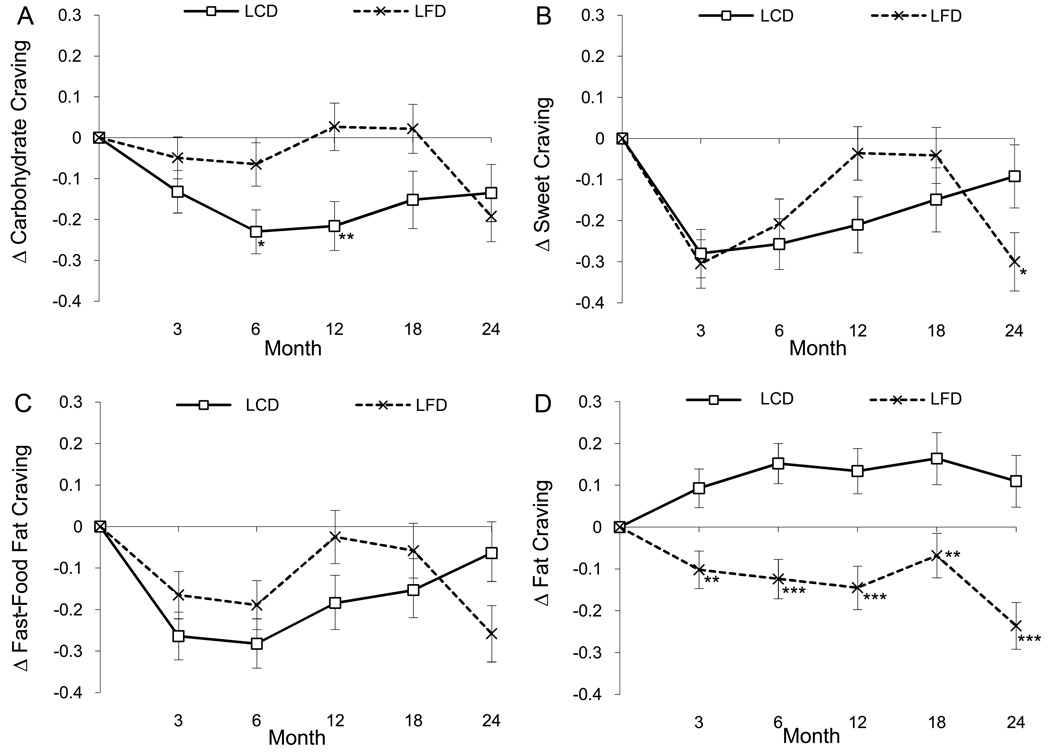
Figure 2.
Change (delta or Δ) in cravings are illustrated for carbohydrates (Panel A), sweets (Panel B), fast-food fats (Panel C), and high-fats (Panel D) by group (LCD and LFD). Asterisks denote the time-points at which significant differences were found between groups with post-hoc tests (*p < .05, **p < .01, p < .001).

