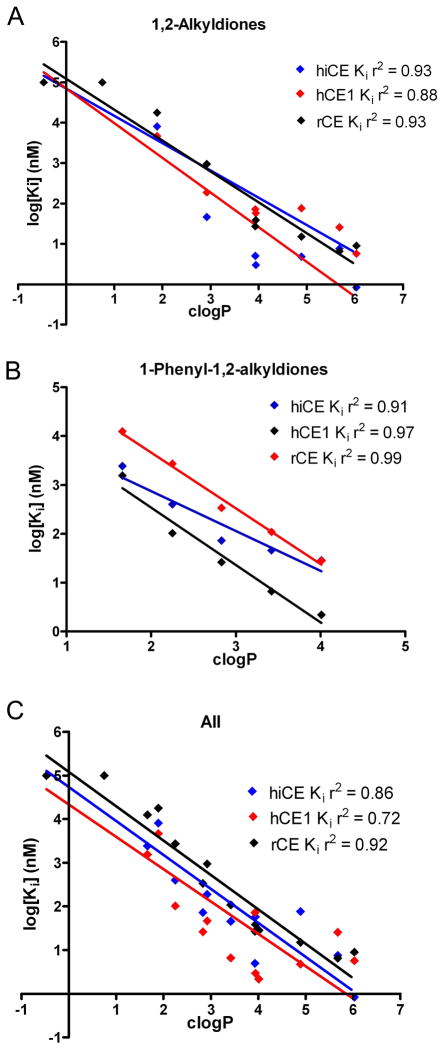
Figure 2.
Graphs demonstrating the correlation between clogP and Ki values for the alkyl 1,2-diones (A), the 1-phenyl-1,2-alkyldiones (B) and composite results for both classes of compounds (C). Data are shown for the three different enzymes hiCE (blue), hiCE (red) and rCE (black) and the corresponding linear correlation coefficient is indicated on the graph.

