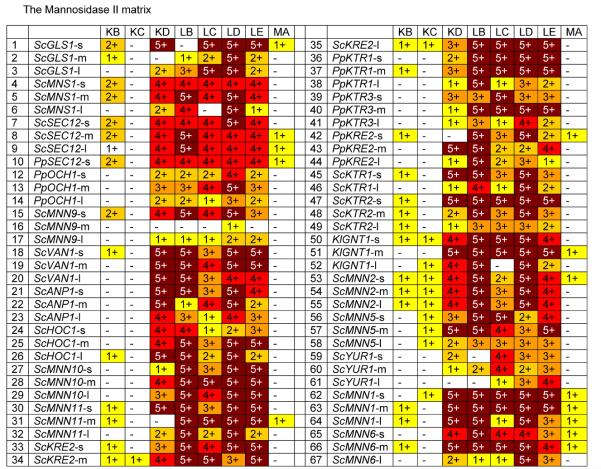
Fig. 5. The Mannosidase II Matrix.
Glycans released from protein expressed in strains transformed with mannosidase II fusions were analyzed by MALDI TOF as described in Materials and Methods. For each fusion a number and color was assigned based on the level of GlcNAc-(Man)3-(GlcNAc)2 detected (as a % of total glycans): - / white = none detected; 1 / yellow = 0 to10%; 2 / gold = 10 to 20%; 3 / orange = 20 to 50%; 4 / red = 50 to 75%; 5 / dark red = >75%. Codes for glycosylation enzymes are given in Table 2. Details on leaders are given in Table 1.

