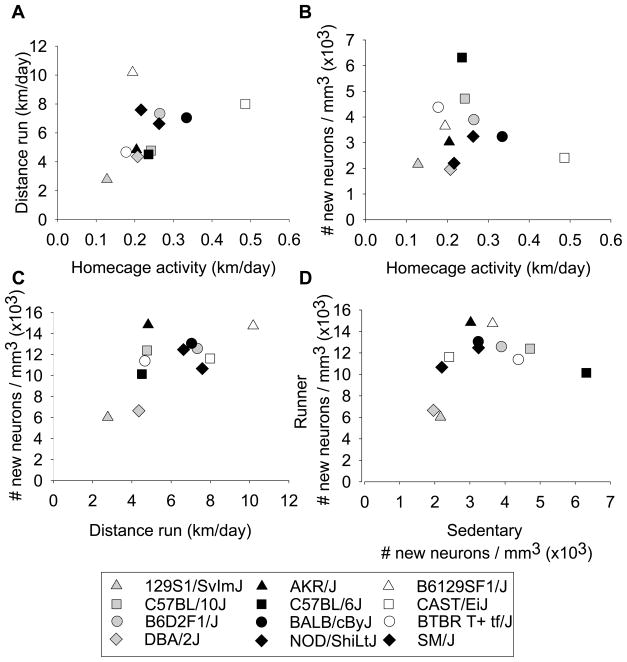
Figure 4.
Genetic correlations. A) Strain mean distance (km/day) accumulated on running wheels plotted against strain mean distance (km/day) traveled in sedentary cages without wheels. B) Strain mean level of neurogenesis under sedentary conditions (i.e., mean number of BrdU positive cells per volume granule layer of the dentate gyrus multiplied by the proportion of BrdU cells expressing NeuN) plotted against strain mean distance traveled in cages without wheels. C) Strain mean level of neurogenesis in runners plotted against strain mean distance run on wheels. D) Strain mean level of neurogenesis in runners plotted against strain mean level of neurogenesis under sedentary conditions.

