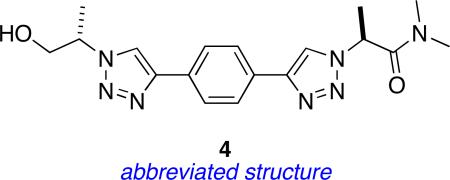
Table 9.
QMD analysis of 4.a
 | |||||||
|---|---|---|---|---|---|---|---|
| F1 | F2 | F3 | F4 | F5 | F6 | F7 | |
| population | 25 | 19 | 16 | 13 | 17 | 5 | 6 |
| | |||||||
| ΔE (kcal/mol) from lowest energy conformer overall | 0.00 | 0.03 | 0.16 | 0.24 | 0.33 | 0.50 | 0.85 |
| | |||||||
| min. Cβ - Cβ in family | 13.92 | 13.18 | 14.10 | 13.63 | 12.62 | 13.35 | 13.78 |
| max. Cβ - Cβ in family | 14.48 | 13.56 | 14.32 | 14.24 | 13.13 | 13.44 | 14.11 |
| | |||||||
| corresponds tob | β-sheetc | α-helix | |||||
A total 10 families were identified, but F8 - 10 were omitted. F8 and F10 have only one structure, and F9 has 3. All the conformers in F8 – 10 were at least 0.92 kcal/mol less stable than the global minimum.
Representative structures in the families highlighted overlay with the these secondary structures as represented in the figures accompanying this table.
Parallel form.
