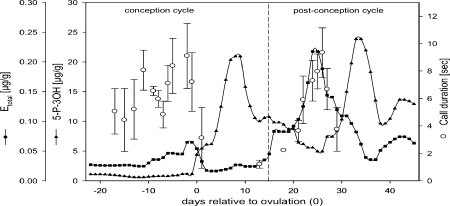
Fig. 2.
Representative pattern of estrogen (Etotal) and progestogen (5-P-3OH) levels, and the time course of call duration (mean ± SD of the females recorded calls at a particular day) during the conception and postconception cycles of female JU (mating season 03/04). The occurrence of a value for call duration also indicates the occurrence of a copulation call on this particular day. The figure includes the 3-d time lag of the hormonal effect on copulation call occurrence and length, i.e., the acoustic data are shifted 3 d backwards.

